$325,000
Median Price
+19% vs county
$381,558
Avg Price
121
Homes Sold (12mo)
66
Avg Days on Market
County: 87
$187
Price / SqFt
County: $176
55
Active Listings
11 pending
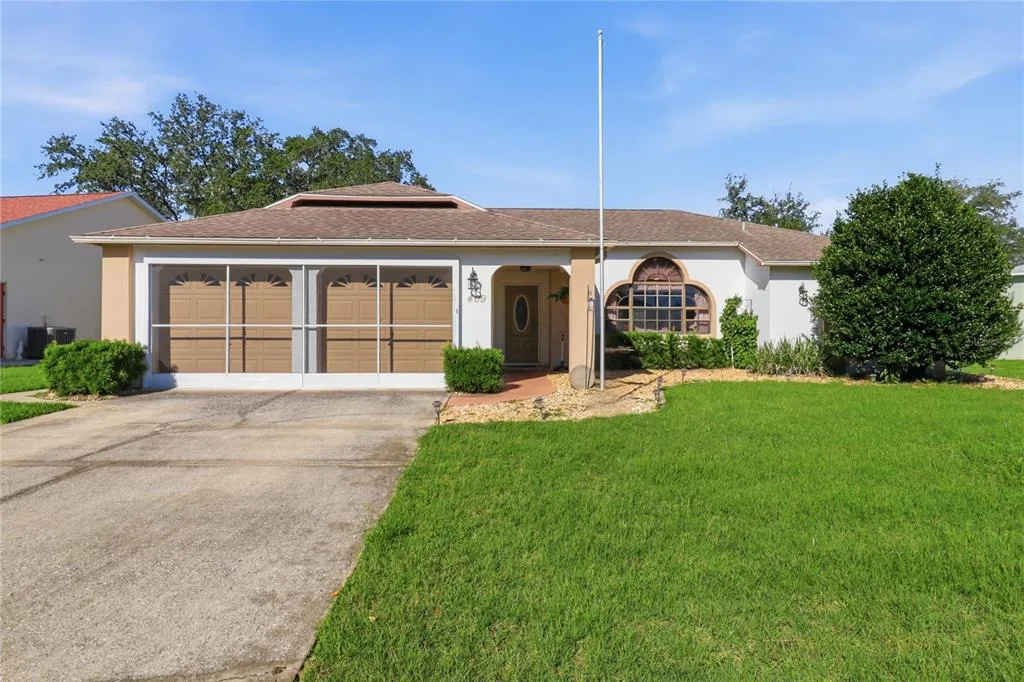
Lecanto Housing Market Overview
The Lecanto, Florida real estate market saw 121 home sales over the past 12 months, with a median sale price of $325,000 and an average sale price of $381,558. This is 19% above the Citrus County median of $274,000. The average time on market in Lecanto is 66 days. The average price per square foot is $187. Currently, there are 55 homes listed for sale and 11 under contract in Lecanto. Over the past 6 months, median prices have decreased by approximately 4%.
Monthly Market Trends
07/253
08/2512
09/257
10/259
11/258
12/258
01/266
02/269
03/264
04/2612
05/2616
06/2614
07/2613
| Month | Sales | Median | Average | DOM | $/SqFt |
|---|---|---|---|---|---|
| 07/26 | 13 | $353,000 | $422,308 | 64 | $181 |
| 06/26 | 14 | $282,500 | $338,000 | 43 | $171 |
| 05/26 | 16 | $336,500 | $364,731 | 77 | $181 |
| 04/26 | 12 | $427,500 | $458,750 | 95 | $208 |
| 03/26 | 4 | $283,688 | $302,719 | 129 | $186 |
| 02/26 | 9 | $299,000 | $306,200 | 72 | $178 |
| 01/26 | 6 | $435,000 | $442,333 | 92 | $207 |
| 12/25 | 8 | $292,000 | $313,625 | 53 | $193 |
| 11/25 | 8 | $311,500 | $502,500 | 80 | $179 |
| 10/25 | 9 | $390,000 | $471,222 | 31 | $204 |
| 09/25 | 7 | $285,000 | $318,786 | 67 | $189 |
| 08/25 | 12 | $314,000 | $308,142 | 53 | $166 |
| 07/25 | 3 | $530,000 | $428,667 | 16 | $240 |
Price Distribution (Last 12 Months)
Under $200K
$200K–$300K
$300K–$400K
$400K–$500K
$500K–$750K
$750K–$1M
$1M+
Lecanto vs Citrus County
| Lecanto | Citrus County | |
|---|---|---|
| Median Price | $325,000 | $274,000 |
| Avg Price | $381,558 | $306,683 |
| Avg DOM | 66 days | 87 days |
| Price / SqFt | $187 | $176 |
| Total Sales | 121 | 3,286 |
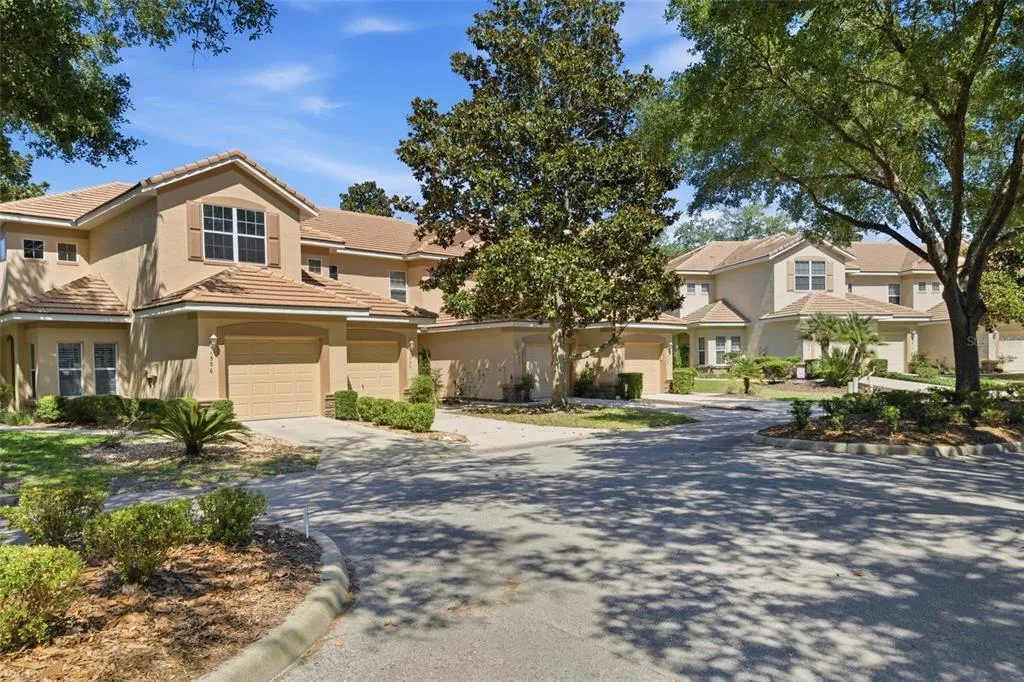
Top Communities in Lecanto
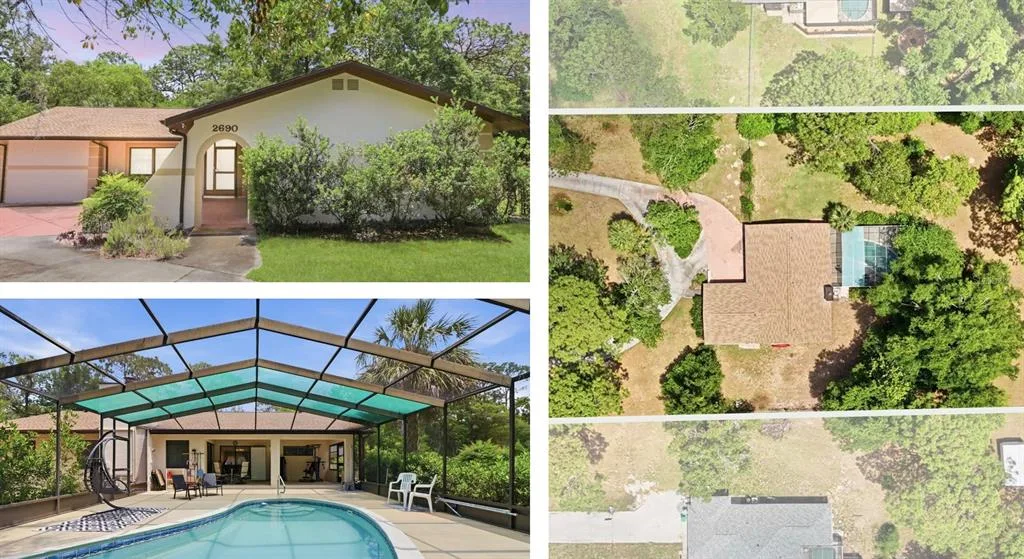
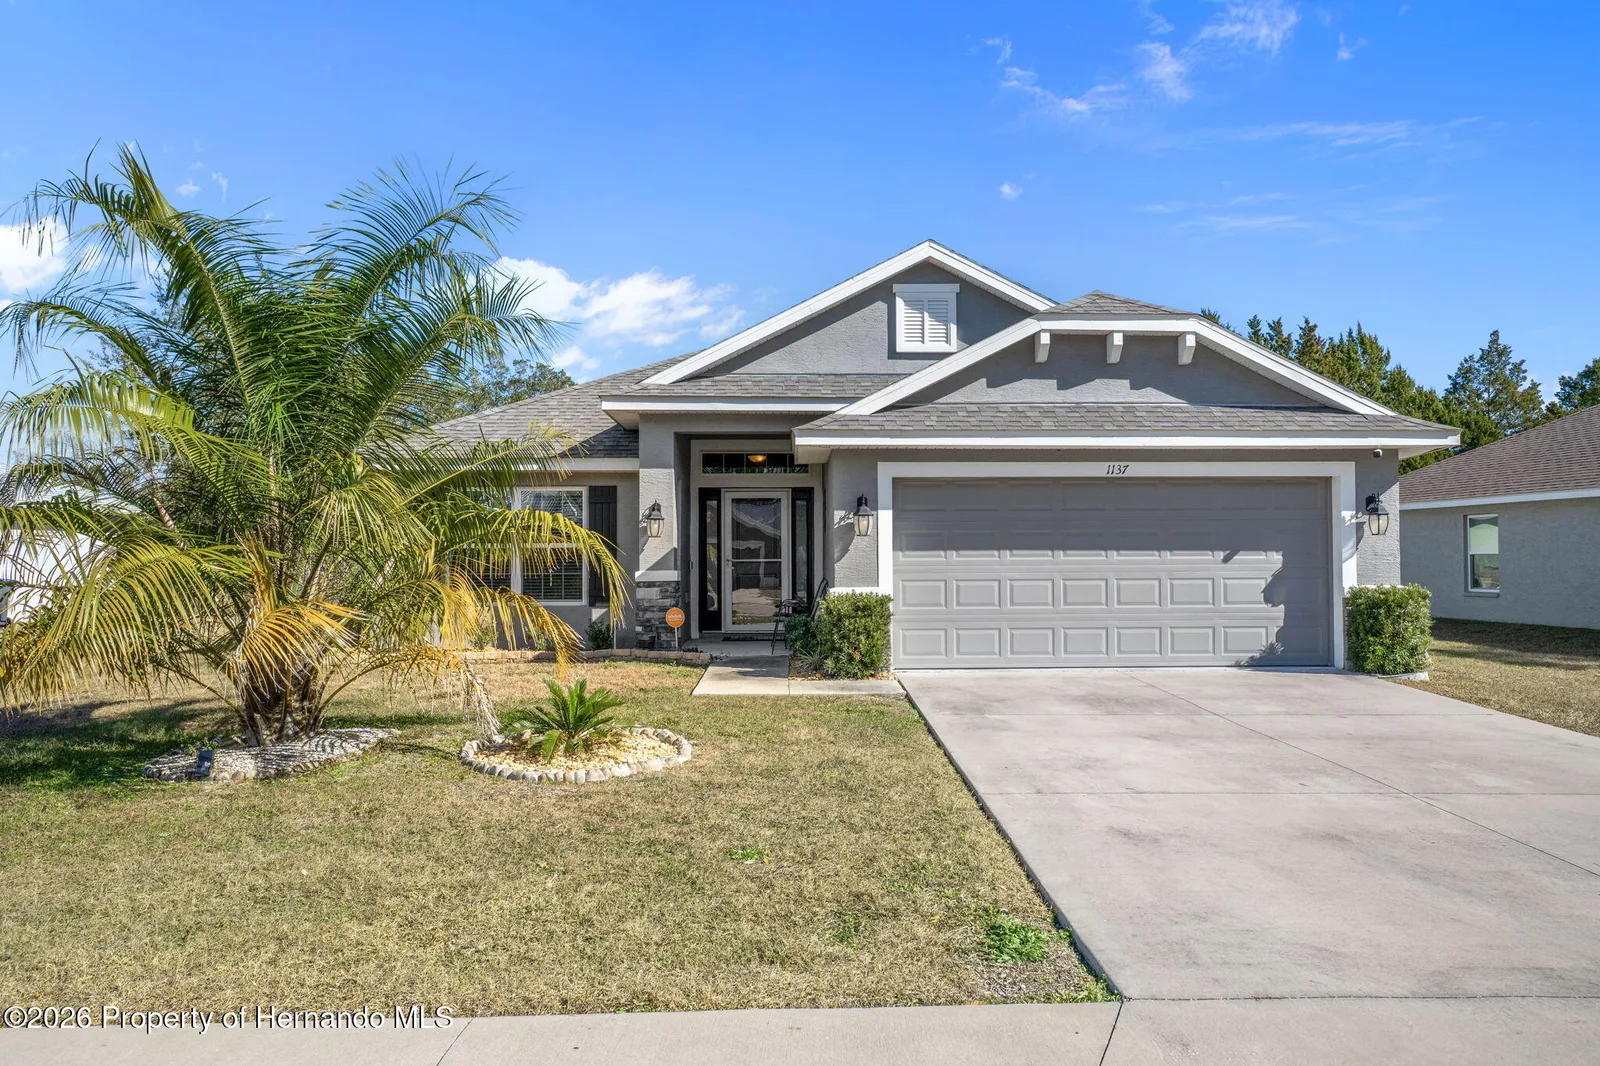
Recently Sold in Lecanto


Frequently Asked Questions
Looking for a Home in Lecanto?
Our agents know Citrus County inside and out.