Hernando Beach, FL Market Report
Hernando County · Updated July 2026
$530,000
Median Price
+68% vs county
$566,188
Avg Price
196
Homes Sold (12mo)
102
Avg Days on Market
County: 75
$324
Price / SqFt
County: $188
120
Active Listings
34 pending
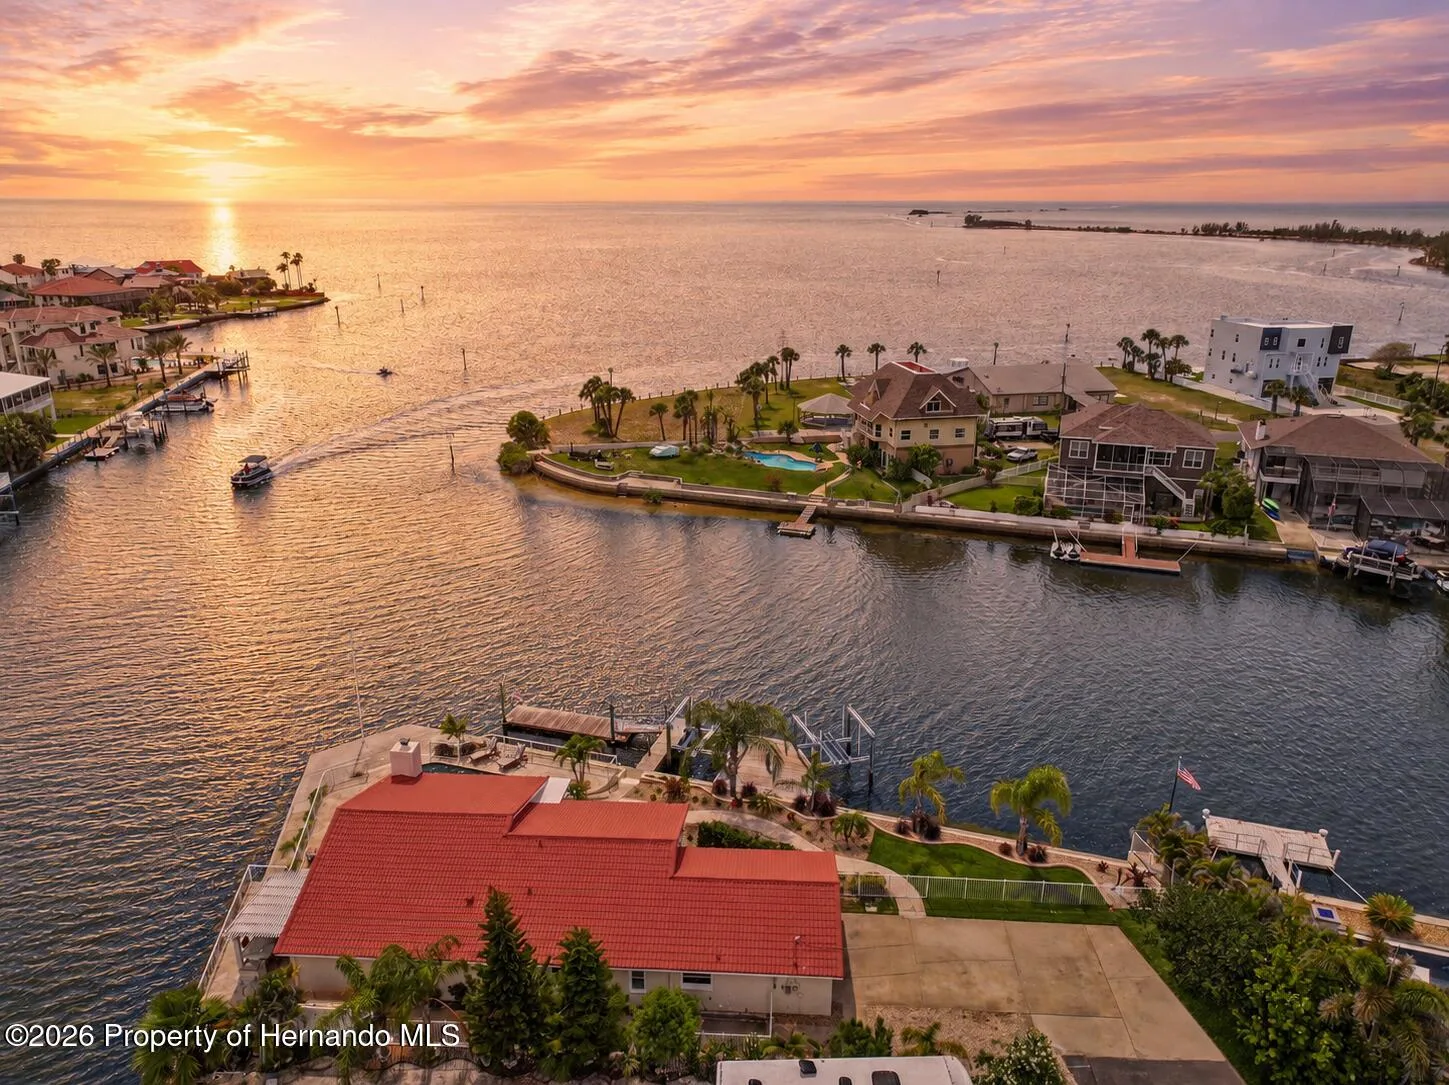
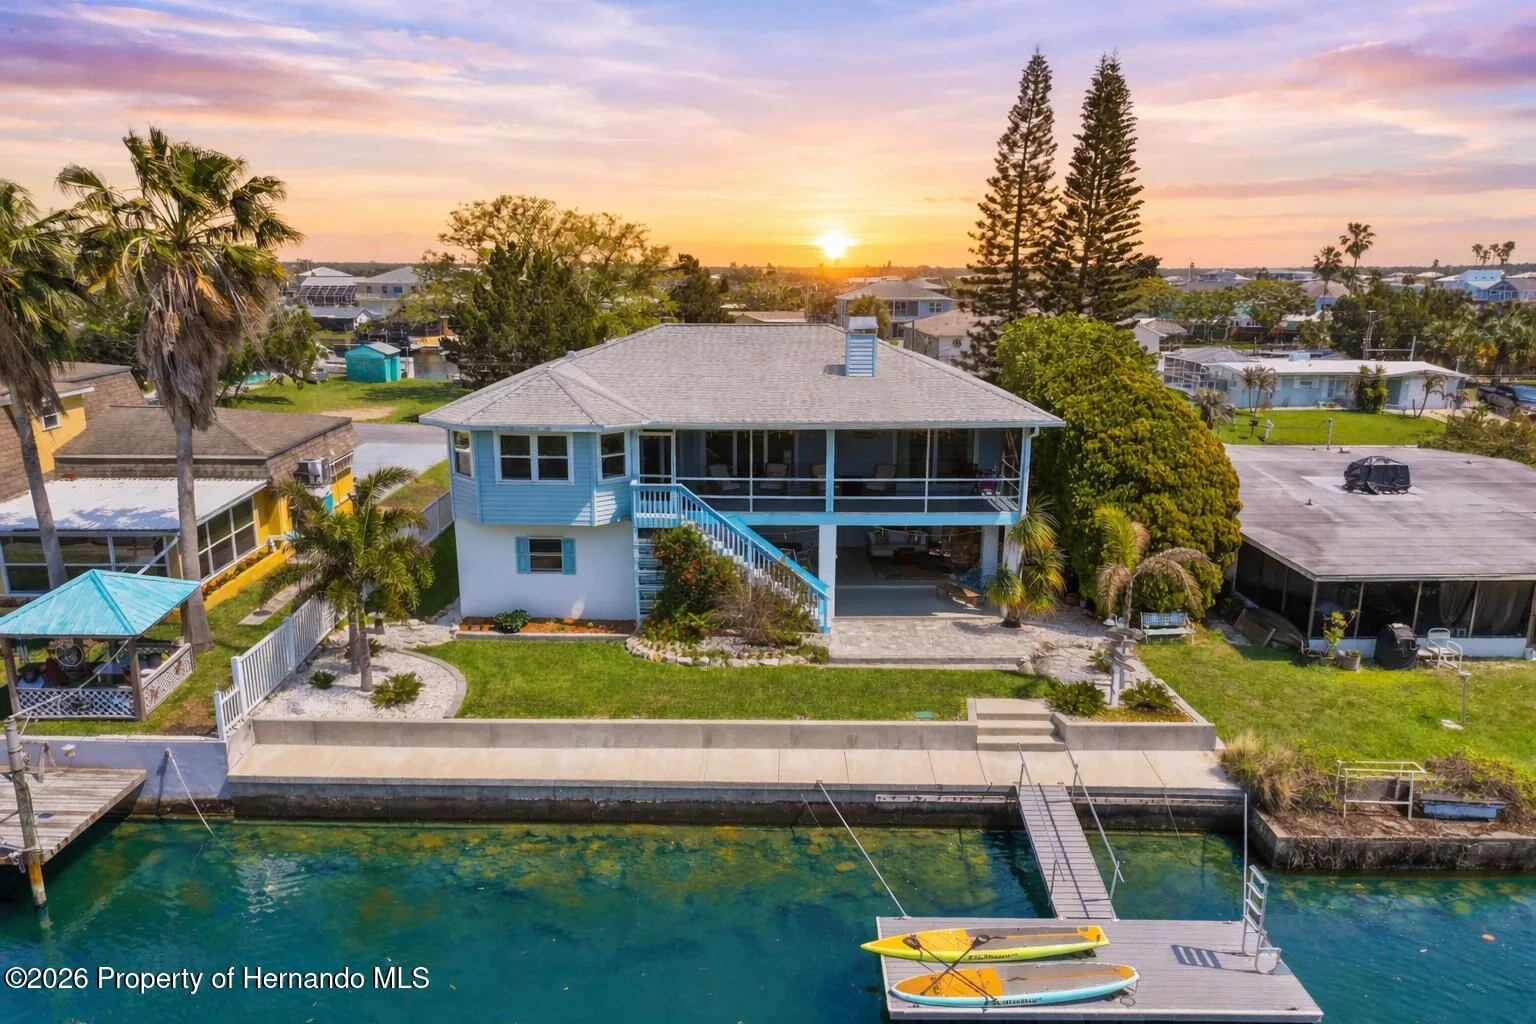
Hernando Beach Housing Market Overview
The Hernando Beach, Florida real estate market saw 196 home sales over the past 12 months, with a median sale price of $530,000 and an average sale price of $566,188. This is 68% above the Hernando County median of $315,000. The average time on market in Hernando Beach is 102 days, compared to 75 days county-wide. The average price per square foot is $324. Currently, there are 120 homes listed for sale and 34 under contract in Hernando Beach. Over the past 6 months, median prices have decreased by approximately 13%.
Monthly Market Trends
| Month | Sales | Median | Average | DOM | $/SqFt |
|---|---|---|---|---|---|
| 07/26 | 9 | $710,000 | $655,889 | 52 | $347 |
| 06/26 | 29 | $500,000 | $509,222 | 149 | $314 |
| 05/26 | 18 | $470,000 | $483,556 | 111 | $290 |
| 04/26 | 13 | $575,000 | $569,615 | 206 | $305 |
| 03/26 | 21 | $725,000 | $715,043 | 96 | $322 |
| 02/26 | 12 | $625,000 | $675,583 | 34 | $419 |
| 01/26 | 5 | $595,000 | $762,000 | 81 | $446 |
| 12/25 | 17 | $500,000 | $482,471 | 135 | $283 |
| 11/25 | 14 | $560,000 | $588,429 | 49 | $368 |
| 10/25 | 15 | $650,000 | $568,267 | 91 | $339 |
| 09/25 | 13 | $550,000 | $527,292 | 118 | $284 |
| 08/25 | 24 | $477,000 | $501,750 | 64 | $316 |
| 07/25 | 6 | $527,314 | $566,605 | 61 | $302 |
Price Distribution (Last 12 Months)
Hernando Beach vs Hernando County
| Hernando Beach | Hernando County | |
|---|---|---|
| Median Price | $530,000 | $315,000 |
| Avg Price | $566,188 | $336,288 |
| Avg DOM | 102 days | 75 days |
| Price / SqFt | $324 | $188 |
| Total Sales | 196 | 6,857 |
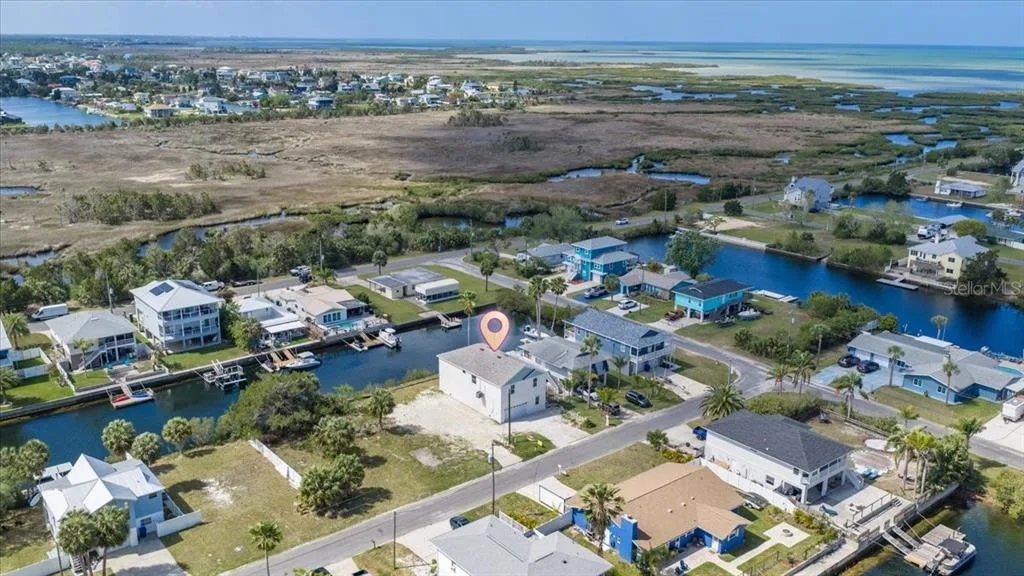
Top Communities in Hernando Beach
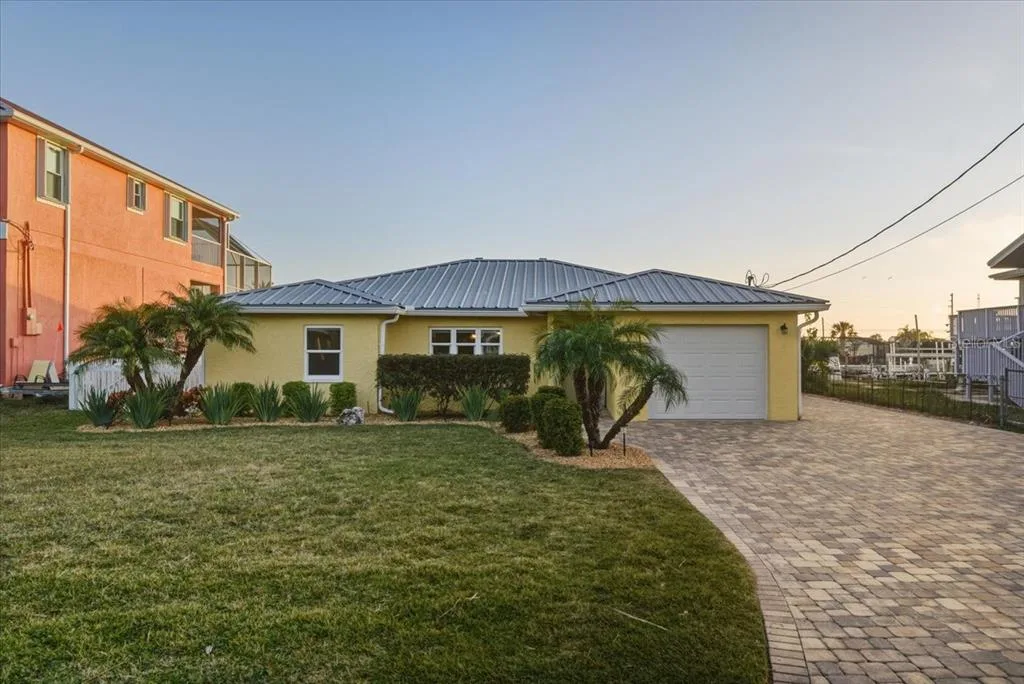
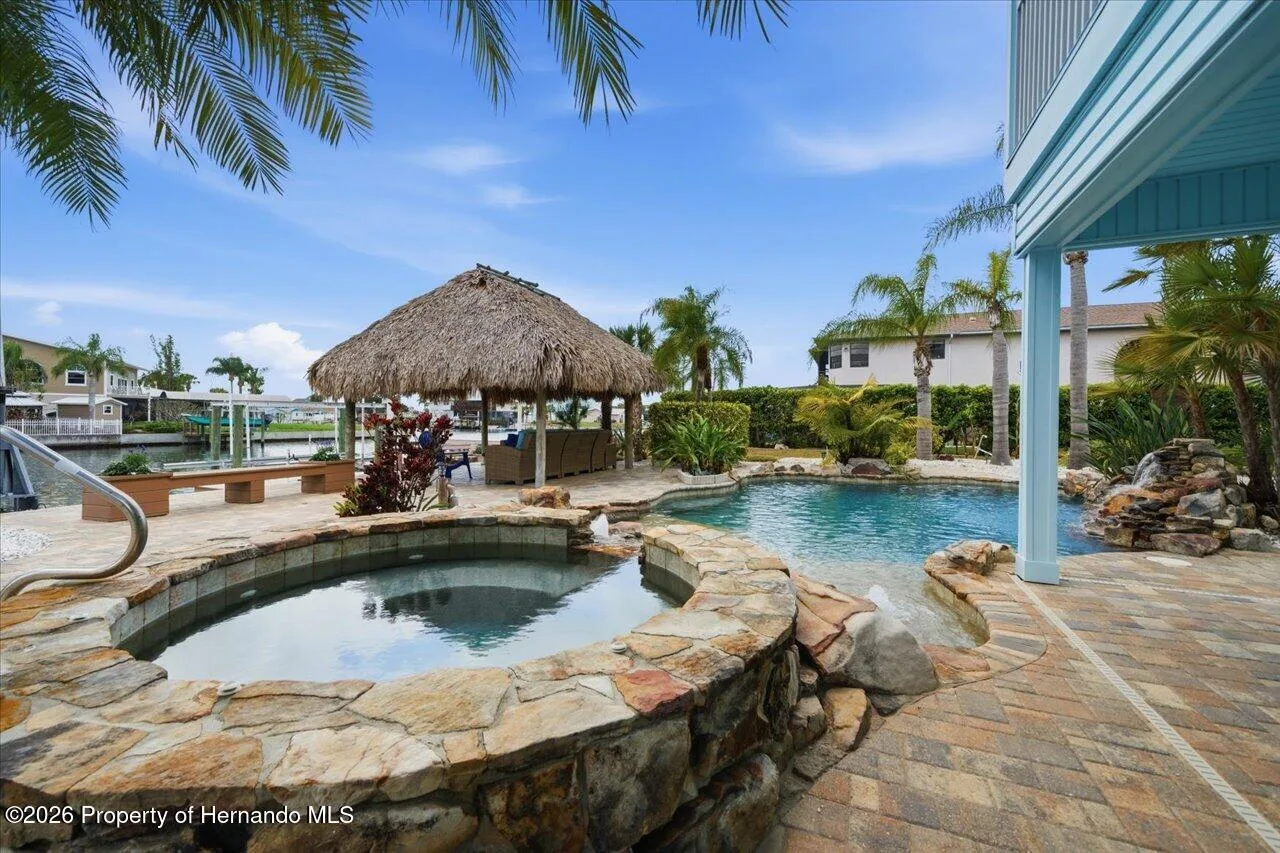
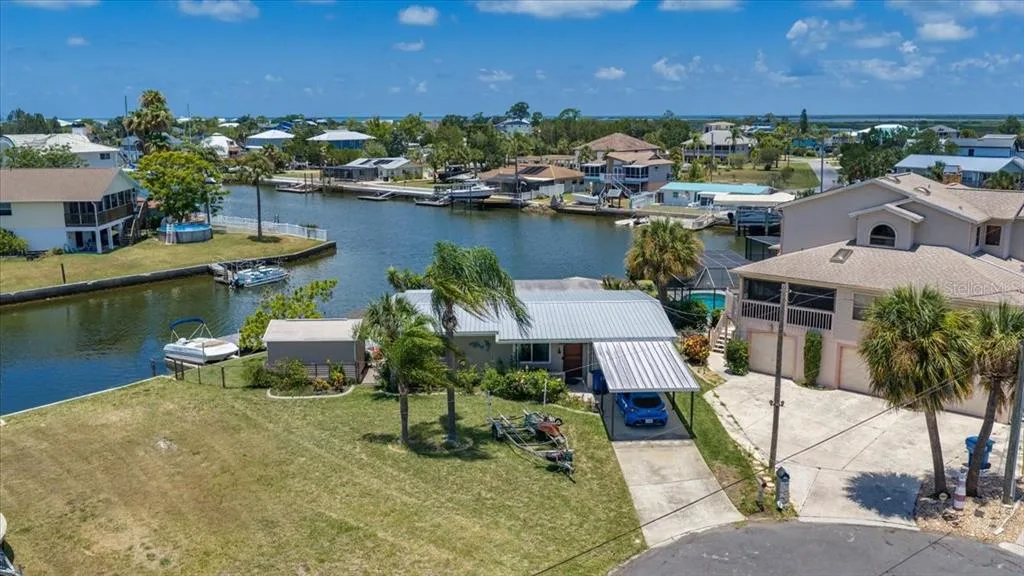
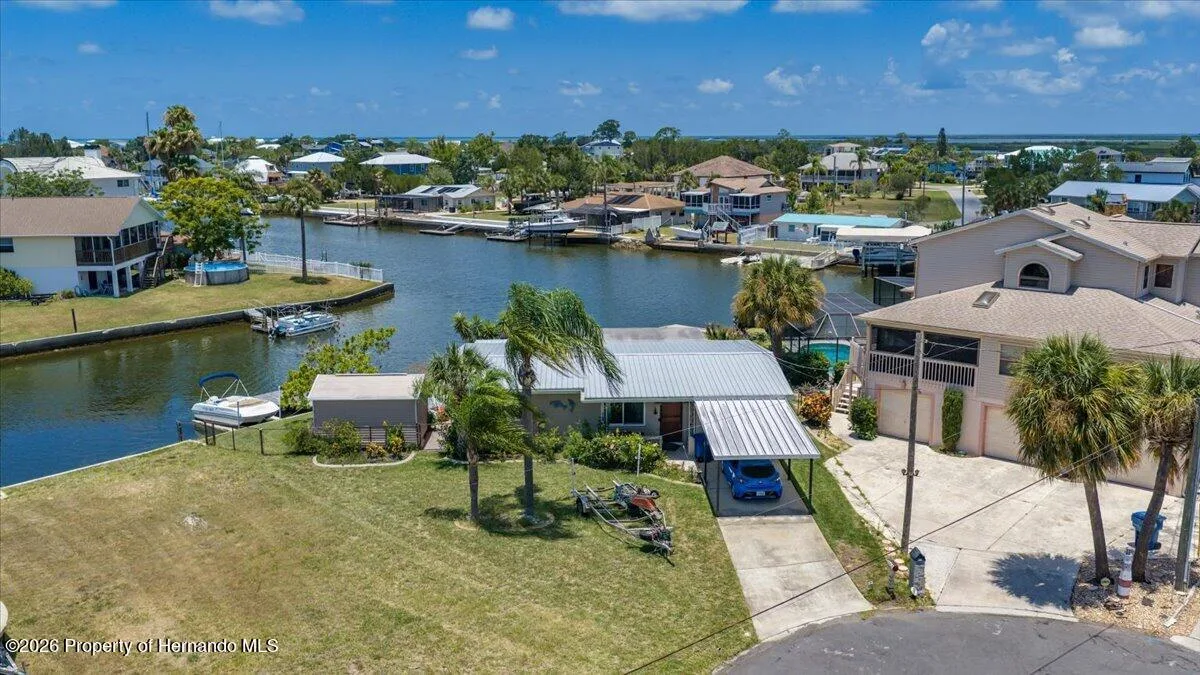
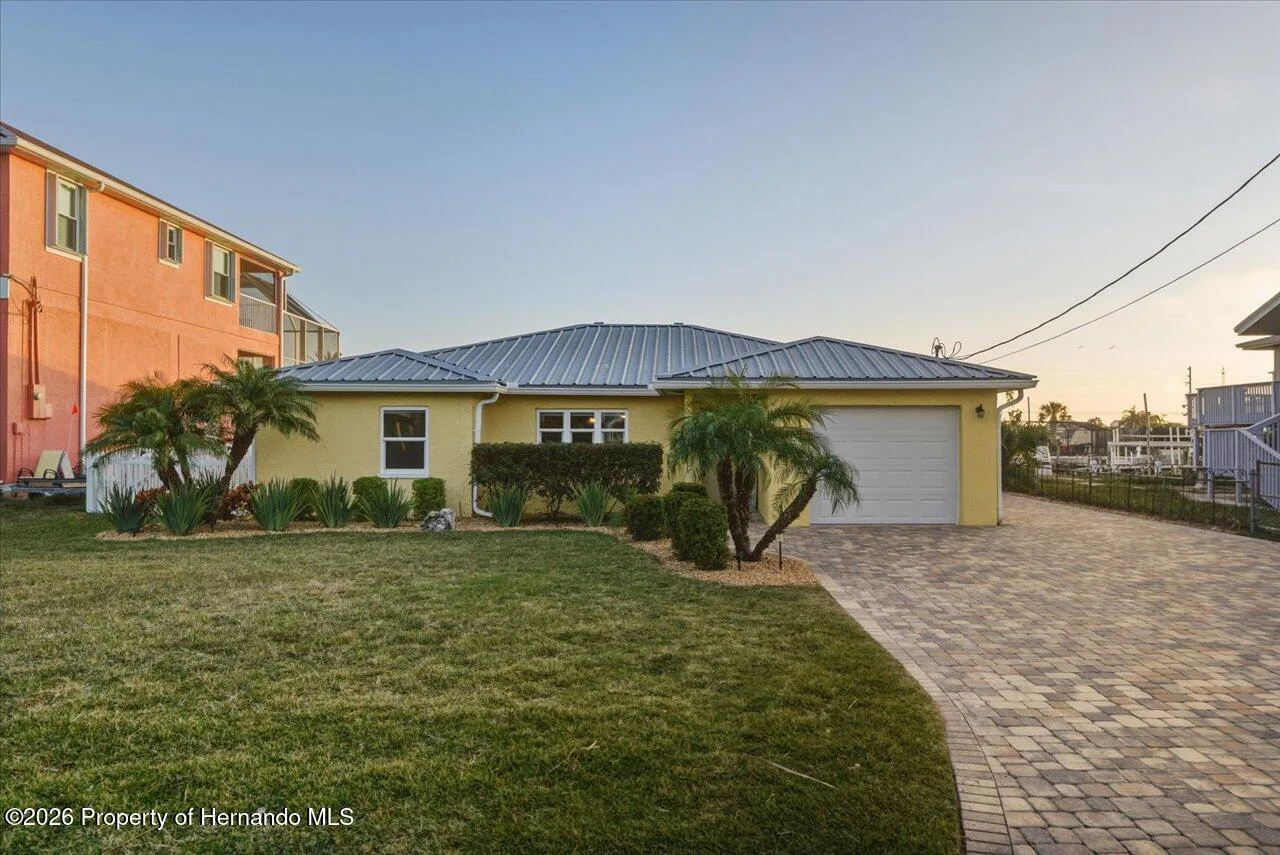
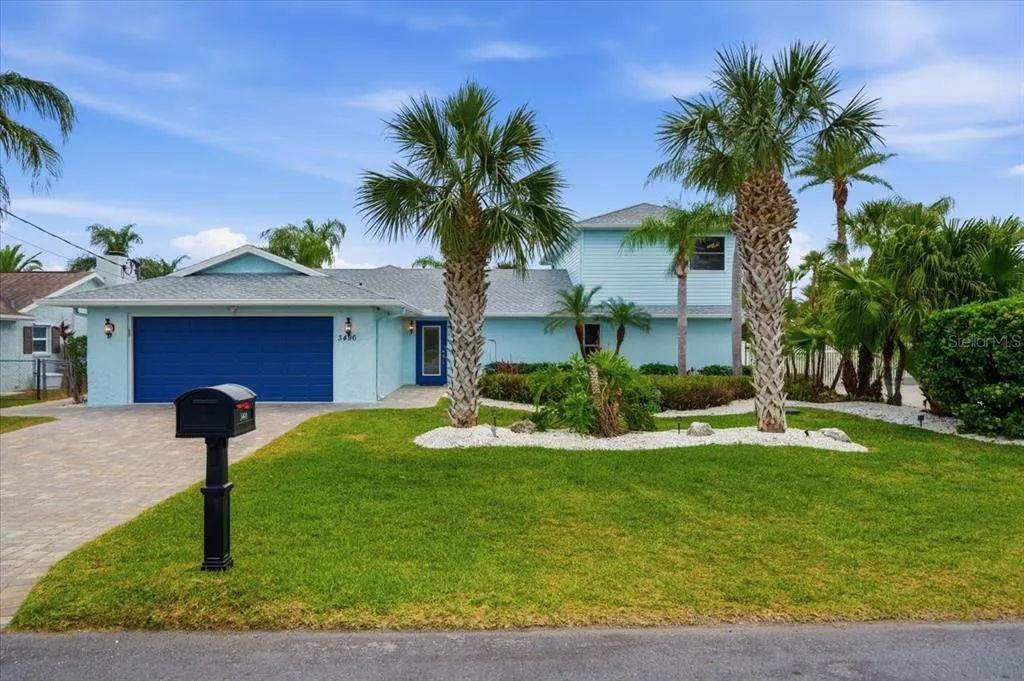
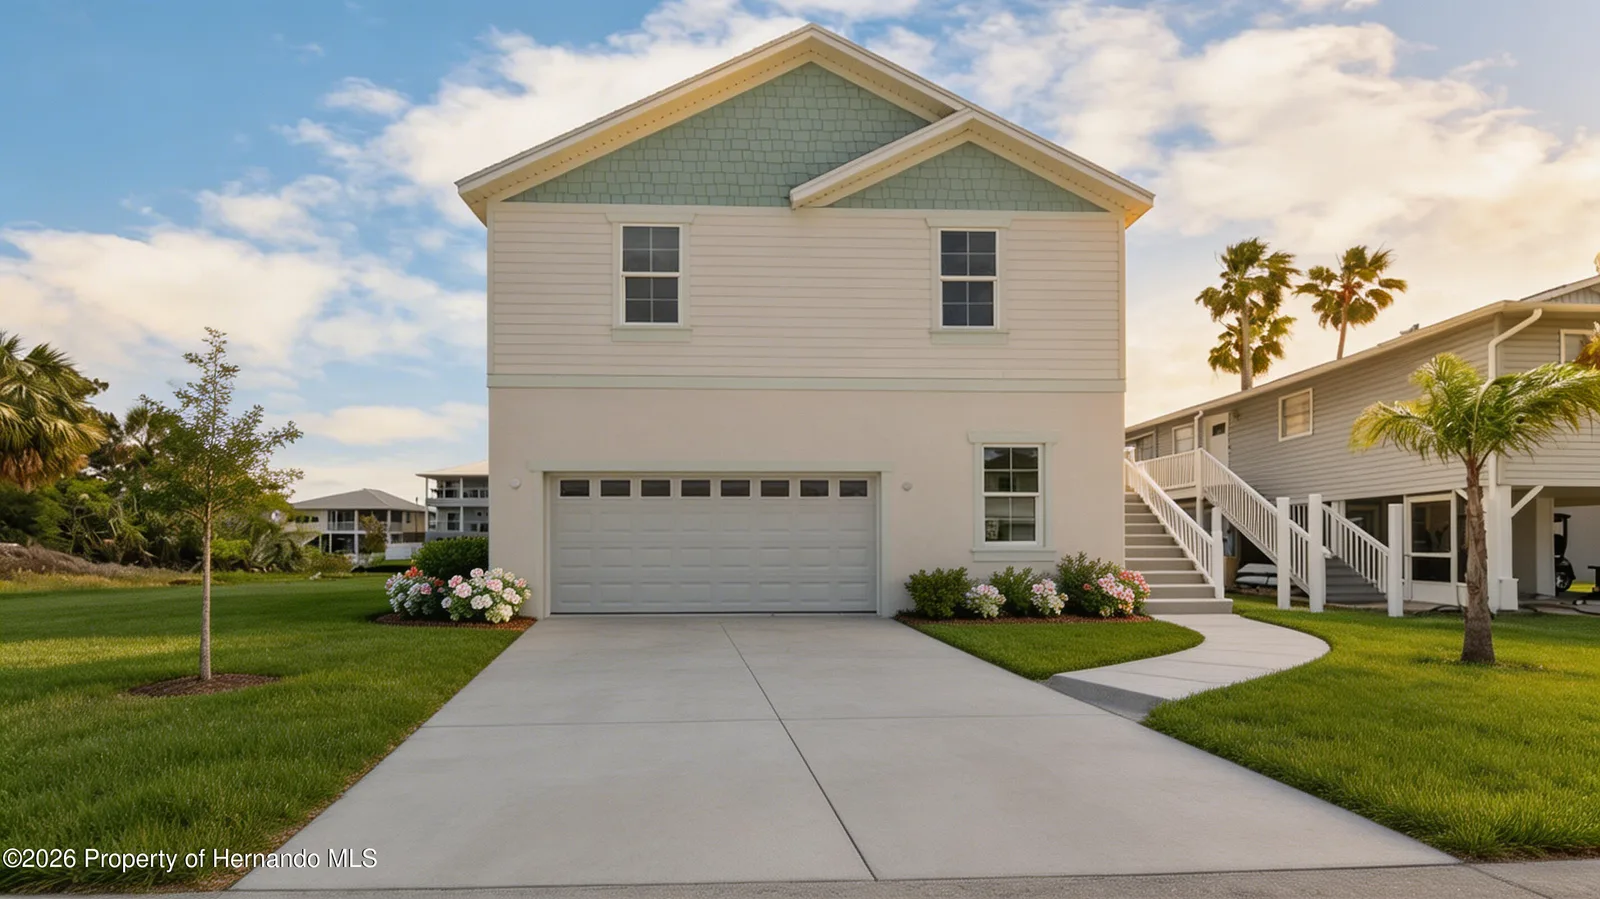
Recently Sold in Hernando Beach
Frequently Asked Questions
Looking for a Home in Hernando Beach?
Our agents know Hernando County inside and out.
All Properties · Hernando Beach Homes · Home Value · About Us